The system status page
Before reporting a problem, it's worth a ten-second check: is the platform itself having an issue? The public status page at https://onflowads.com/status shows the live health of Onflow Ads systems and any active incident notice from the team.
No sign-in is required, and the page keeps working even while the rest of the site is in maintenance — which is exactly when you'd want it.
When to check it
- The site feels slow, or actions fail with generic errors.
- The Telegram bot isn't responding.
- You've hit a maintenance page and want the bigger picture.
- Before you write in, so your message can say "the status page shows X".
Reading the page
The whole page is one column: a headline card at the top, one row per monitored component beneath it, and the freshness line at the bottom.
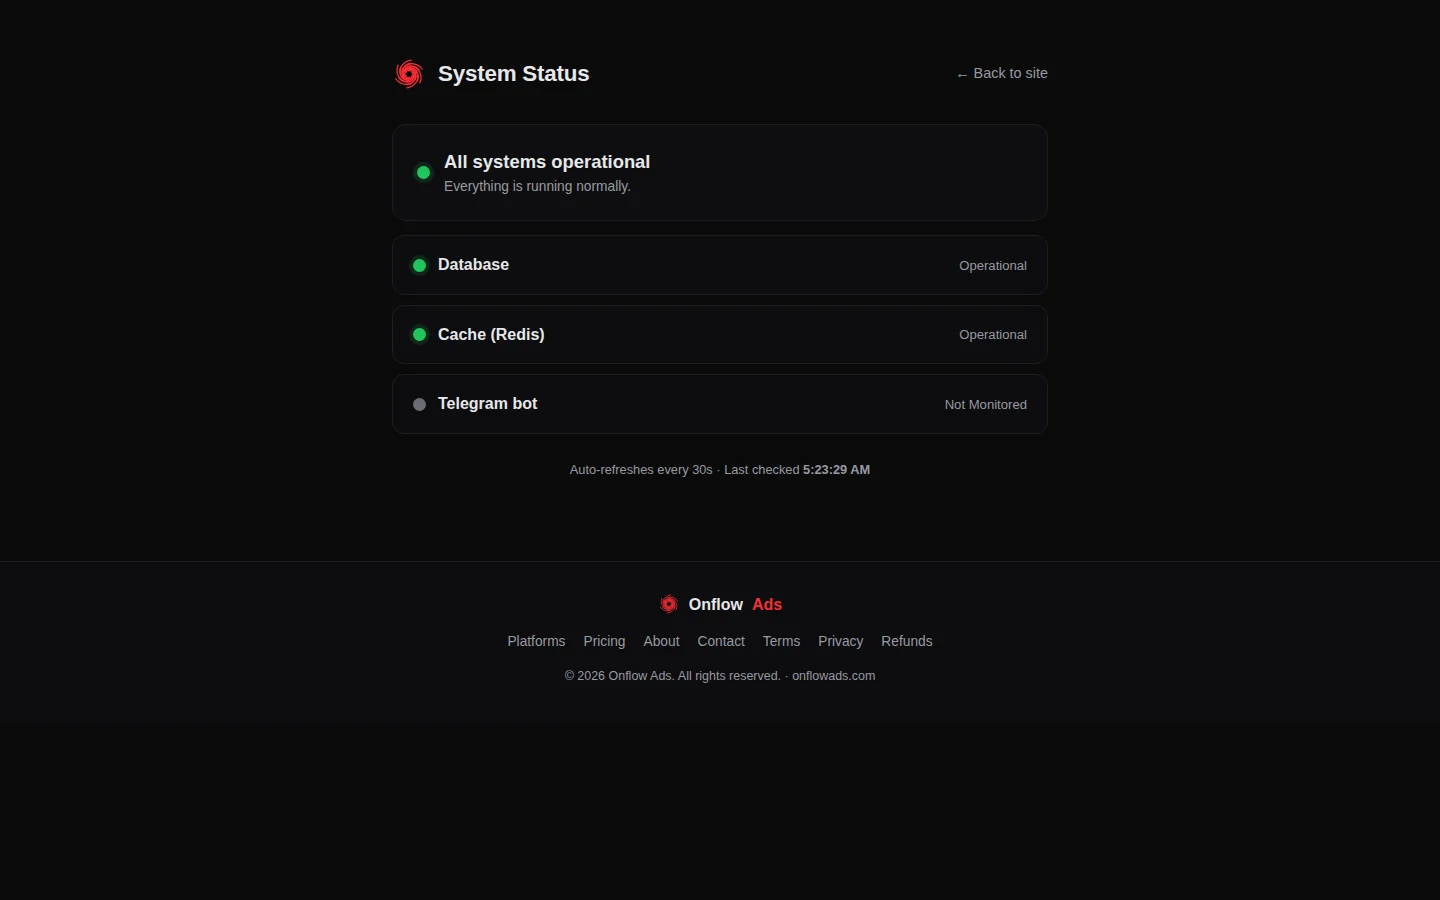
The status page. Green dots on the left, the component's own label on the right, and the last-checked time at the bottom.
The headline
At the top, one line summarises everything:
| Headline | Dot | What it means |
|---|---|---|
| All systems operational | Green | Everything being monitored is running normally. The sub-line reads "Everything is running normally." |
| Some systems are degraded | Amber | At least one monitored component is failing its check. The sub-line reads "We're aware and working on it." |
| Status unavailable | Red | Your browser couldn't reach the status service itself. The sub-line reads "We couldn't reach the status service. Please retry shortly." |
It means the status check itself didn't complete — often a network problem on your side, sometimes ours. Retry shortly, or try from another network or device. See the Troubleshooting & FAQ.
The components
Below the headline, each monitored component is listed with its own indicator:
| Component | What it covers |
|---|---|
| Database | The core storage behind accounts, orders, campaigns, wallets and support conversations. |
| Cache | The fast-access layer that keeps pages loading quickly. |
| Telegram bot | Whether the official Onflow Ads Telegram bot is reachable. |
Each one shows one of three labels:
| Label | Dot | Meaning |
|---|---|---|
| operational | Green | Healthy right now. |
| down | Red | Failing its health check at this moment. |
| not monitored | Grey | This component isn't being checked from here right now. It says nothing about whether it's working. |
Only components that can actually be judged count toward it. A component showing not monitored never drags the overall status down — so you can see All systems operational at the top with a not monitored row underneath, and that is consistent, not a bug.
Incident notices
When the team has posted an incident message, it appears as a highlighted amber banner near the top of the status page, above the headline card.
The same notice is also shown as a strip across the top of regular site pages, so you generally learn about an incident without having to visit the status page at all. The strip stays in place as you browse and doesn't need to be dismissed.
An incident notice is written by a person. It can be present even while every component reads operational — for example when a specific feature is affected rather than a whole system.
Freshness
- The page checks again every 30 seconds on its own.
- The exact time of the last successful check is shown at the bottom: "Auto-refreshes every 30s · Last checked …", in your device's local time.
- There is nothing to reload manually. If you're waiting for recovery, leave the tab open and watch that line move.
At the bottom of the page there's also a compact site footer with links to Platforms, Pricing, About, Contact, Terms, Privacy and Refunds, plus a Back to site link at the top right.
What the status page does not cover
The status page reports platform-wide health. It cannot see anything specific to you, so it will show All systems operational even if:
- your sign-in is failing because of your own account state;
- a single order or campaign is stuck;
- a payment hasn't been credited;
- your browser, extension, or network is the problem.
The problem is likely specific to your account or setup. Head to Troubleshooting & FAQ, then write to the team with the page URL, what you were doing, and the exact error text.
Edge cases
The page shows "Some systems are degraded" — should I report it? No need. A degraded reading is generated by our own health checks, and the team sees it too. Watch the page; it refreshes itself.
A component says "down" but the feature I use works fine. Possible and normal — a component can fail a health check while parts of the product carry on. Treat it as "expect some things to misbehave", not "everything is broken".
The whole site is on a maintenance page but the status page loads. That's deliberate. The status page and its data stay reachable during maintenance. See Maintenance windows.
I see the incident strip on site pages but the status page shows everything green. The strip is a message from the team, not an automated readout. Read the message — it will say what's affected.
FAQ
Do I need an account to see the status page? No. It's public, and it's a good page to keep bookmarked.
Is there a status history or an uptime chart? The page shows the live picture, not a history.
Can I subscribe to status updates? There's no subscription on the page. Incident notices appear both there and as a strip across the site, so simply visiting Onflow Ads keeps you informed.
The Telegram bot says "not monitored" — is the bot down? No. It means bot health isn't being checked from the status page at the moment. Open the bot in Telegram to find out.
Next: if the site is showing a holding page rather than an error, read Maintenance windows.